
The Spreadsheet Graveyard
I remember the exact moment I knew something had to change.
It was 2:47 AM on a Tuesday. I was staring at seventeen
browser tabs, each one a different dashboard—Google Analytics in one, Google
Ads in another, Facebook Ads Manager, WooCommerce reports, a handful of
spreadsheets trying to connect dots that refused to connect. My coffee had gone
cold hours ago. And somewhere in the mess of numbers, I was supposed to find
the answer to a simple question: Is this business actually healthy?
That question should have been easy. After all, we're living
in the golden age of data. Every platform promises insights. Every tool offers
analytics. Every dashboard claims to give you the full picture. But sitting
there in the blue glow of too many screens, I realized something that would
change the trajectory of my work: We don't have a data problem. We have a
connection problem.
The data was everywhere. It was drowning me. What I needed
wasn't more information—I needed clarity.
That's the night FRANK was born. Not as code, not as a
product, but as a desperate question scribbled on a Post-it note that's still
stuck to my monitor: What if all this actually talked to each other?
The Micro-Signal Problem
Here's what I've learned working with entrepreneurs and
small business owners: they're swimming in what I call micro-signals. Every
sale, every ad click, every website visit, every social media engagement—each
one is a tiny signal about their business health. But these signals are
scattered across a dozen platforms, speaking different languages, measured in
different ways, and impossible to see as a whole.
Think about it. Your Google Ads dashboard tells you your
cost-per-click is $1.23 and your CTR is improving. Good news, right? But it
doesn't tell you that those clicks are going to products that have a 15%
margin. Your WooCommerce reports show revenue is up this month. Great! But they
don't mention that your best-selling product is about to go out of stock
because nobody connected the sales velocity to inventory levels. Your Facebook
insights say engagement is through the roof. Wonderful! But they can't tell you
that the posts getting engagement aren't driving any actual traffic to your
site.
Each platform is doing its job. Each dashboard is
technically correct. But the business owner—the person who needs to make actual
decisions—is left playing a game of connect-the-dots where nobody gave them the
dots or told them what picture they're supposed to make.
I call this the micro-signal problem: More data than ever,
but less insight than we need.
And here's the cruel irony: the smaller your business, the
more this hurts you. Enterprise companies have analytics teams dedicated to
connecting these dots. They have data engineers building pipelines and business
intelligence specialists creating unified dashboards. But the entrepreneur? The
small business owner with maybe one employee and definitely no dedicated data
team? They're expected to be the CEO, the marketer, the accountant, the product
manager, and somehow also the data analyst who makes sense of it all.
I've watched smart, capable business owners make gut
decisions—not because they don't value data, but because making sense of the
data available to them would be a full-time job they don't have time for. I've
seen promising businesses miss warning signs that were technically visible,
scattered across platforms, but never assembled into a coherent picture until
it was too late.
That's not a failure of the business owner. That's a failure
of the tools we've built.
What If Your Business Could See Itself?
Let me paint you a picture. Imagine waking up and opening a
single dashboard that tells you:
- Your advertising spend is working, but platform
X is outperforming platform Y by 3x on the products that matter - Three products are trending up and two are
trending down, with clear explanations of why - Your blog post from last week is driving
traffic, but it's not converting—here's the disconnect - Your social engagement is strong on the
platforms where your customers actually shop, weaker where they don't - Based on current velocity, you'll need to
reorder inventory on these five items in the next two weeks - Overall business health score: 73/100, up from
68 last month, with three specific actions that would move the needle
Not seventeen tabs. Not manual spreadsheet gymnastics. Not
gut feelings about what might be working. Just... clarity.
That's what I wanted to build. A system that takes all those
micro-signals—the sales data, the advertising metrics, the web analytics, the
social engagement, the content performance—and transforms them into something
you can actually use. A macro view created from micro-signals. A way for your
business to finally see itself clearly.
I named it FRANK, because that's what it needed to be:
honest, direct, and clear. No dashboard vanity metrics designed to make
platforms look good. No obfuscated data that requires a statistics degree to
interpret. Just frank answers to the questions that actually matter.
Find what's happening across your entire business
Report the metrics that actually matter, not the ones that
look impressive
Analyze patterns you'd never see looking at data in
isolation
Navigate toward decisions with confidence, not guesswork
Know your business health at a glance, with depth when you
need it
Building With AI, Not Just Using It
Here's where the story takes a turn that still surprises me.
I'm not a 10-person development team. I'm one person with a
vision and a problem to solve. Traditionally, building something like FRANK
would require a team of specialists—backend developers, frontend engineers,
data scientists, UX designers. The scope of connecting multiple platforms,
building analytics engines, creating useful visualizations... it's not a
weekend project.
But we're living in a different era now. And this is the
part of the FRANK story that I think matters most for other entrepreneurs and
builders reading this.
When I started building FRANK, I didn't just use AI as a
tool. I used it as a co-builder.
Claude became my architecture consultant, helping me think
through how different modules should connect. GPT helped me prototype APIs
faster than I ever could alone. When I got stuck on complex data
transformations, AI helped me think through edge cases I would have missed.
When I needed to build something I'd never built before—integrating with Google
Ads API, handling OAuth flows for multiple platforms, designing database
schemas for multi-tenant systems—AI was there as a knowledgeable partner.
I want to be clear about what this means and what it
doesn't.
AI didn't build FRANK for me. AI doesn't understand my
business. AI doesn't know what entrepreneurs actually need when they're staring
at their data at 3 AM. AI doesn't have taste or judgment about what matters
versus what's just technically possible.
But AI amplified my ability to execute on my vision in ways
that would have been impossible even a few years ago. It's like having a team
of experts I can consult at any hour, who never get tired of explaining things,
who can help me implement solutions I can barely articulate.
This is the model I believe in: human judgment and vision,
AI execution and assistance. The decisions about what to build, why it matters,
and how it should work—those come from me. The ability to actually build it
without a massive team—that's where AI changed everything.
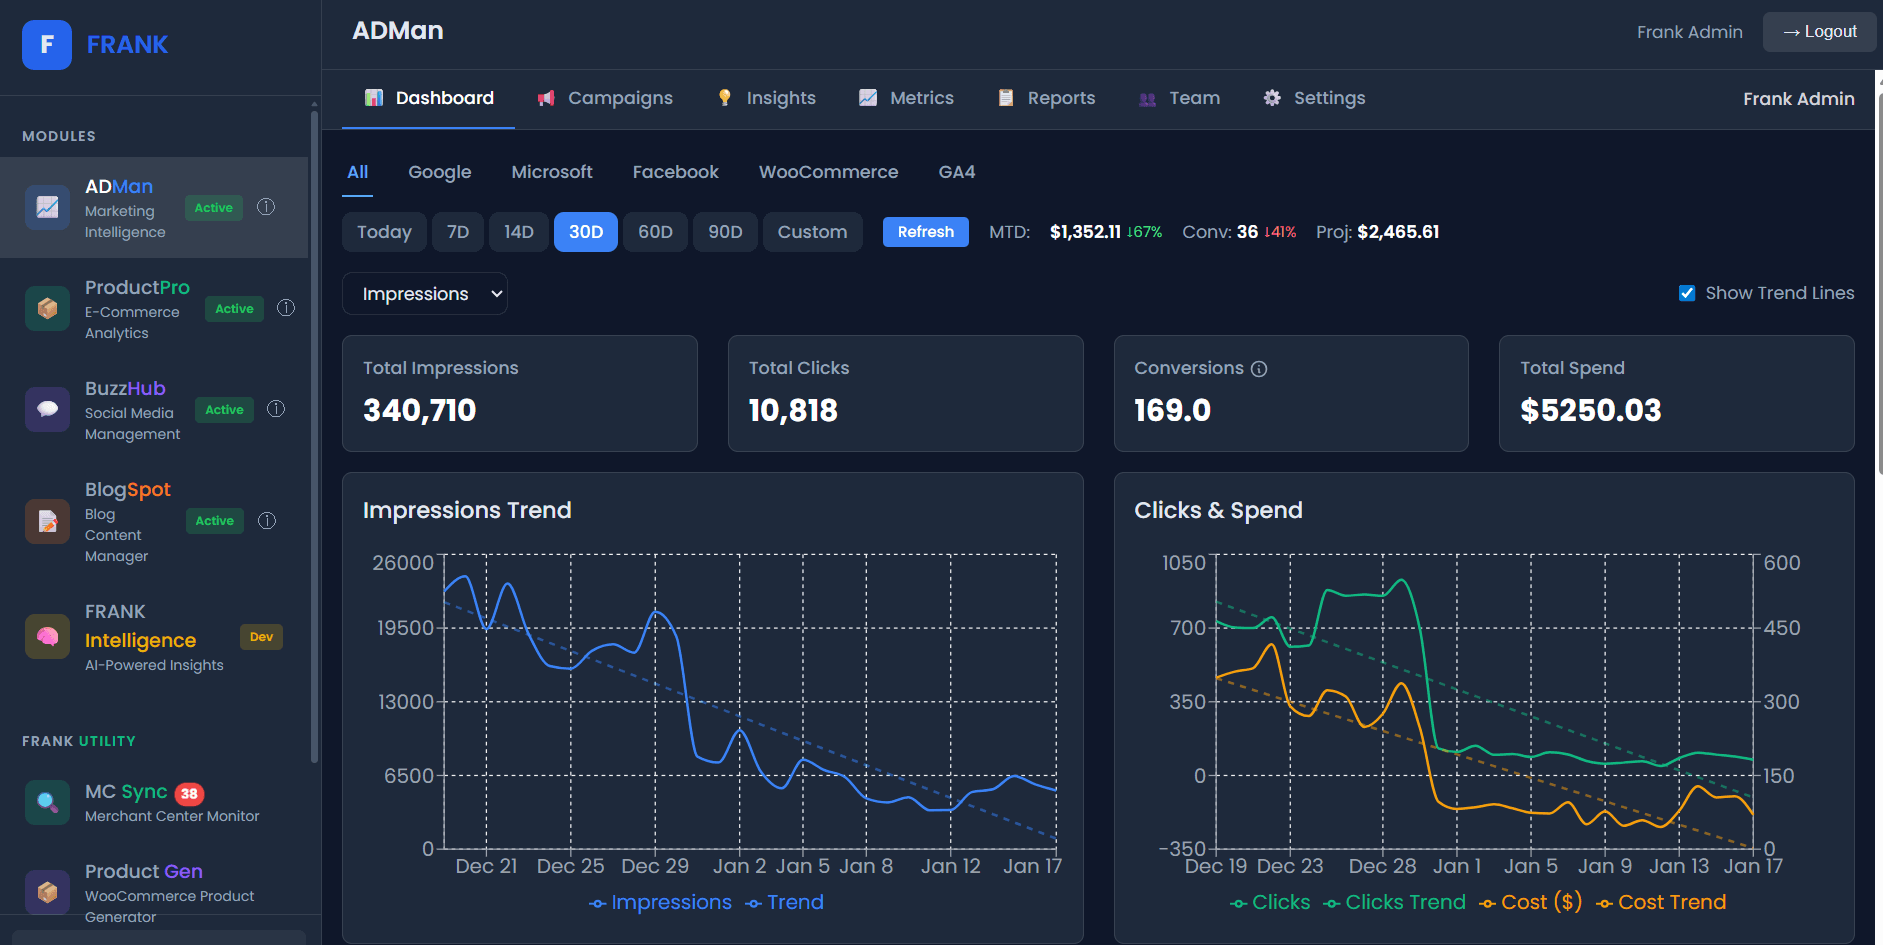
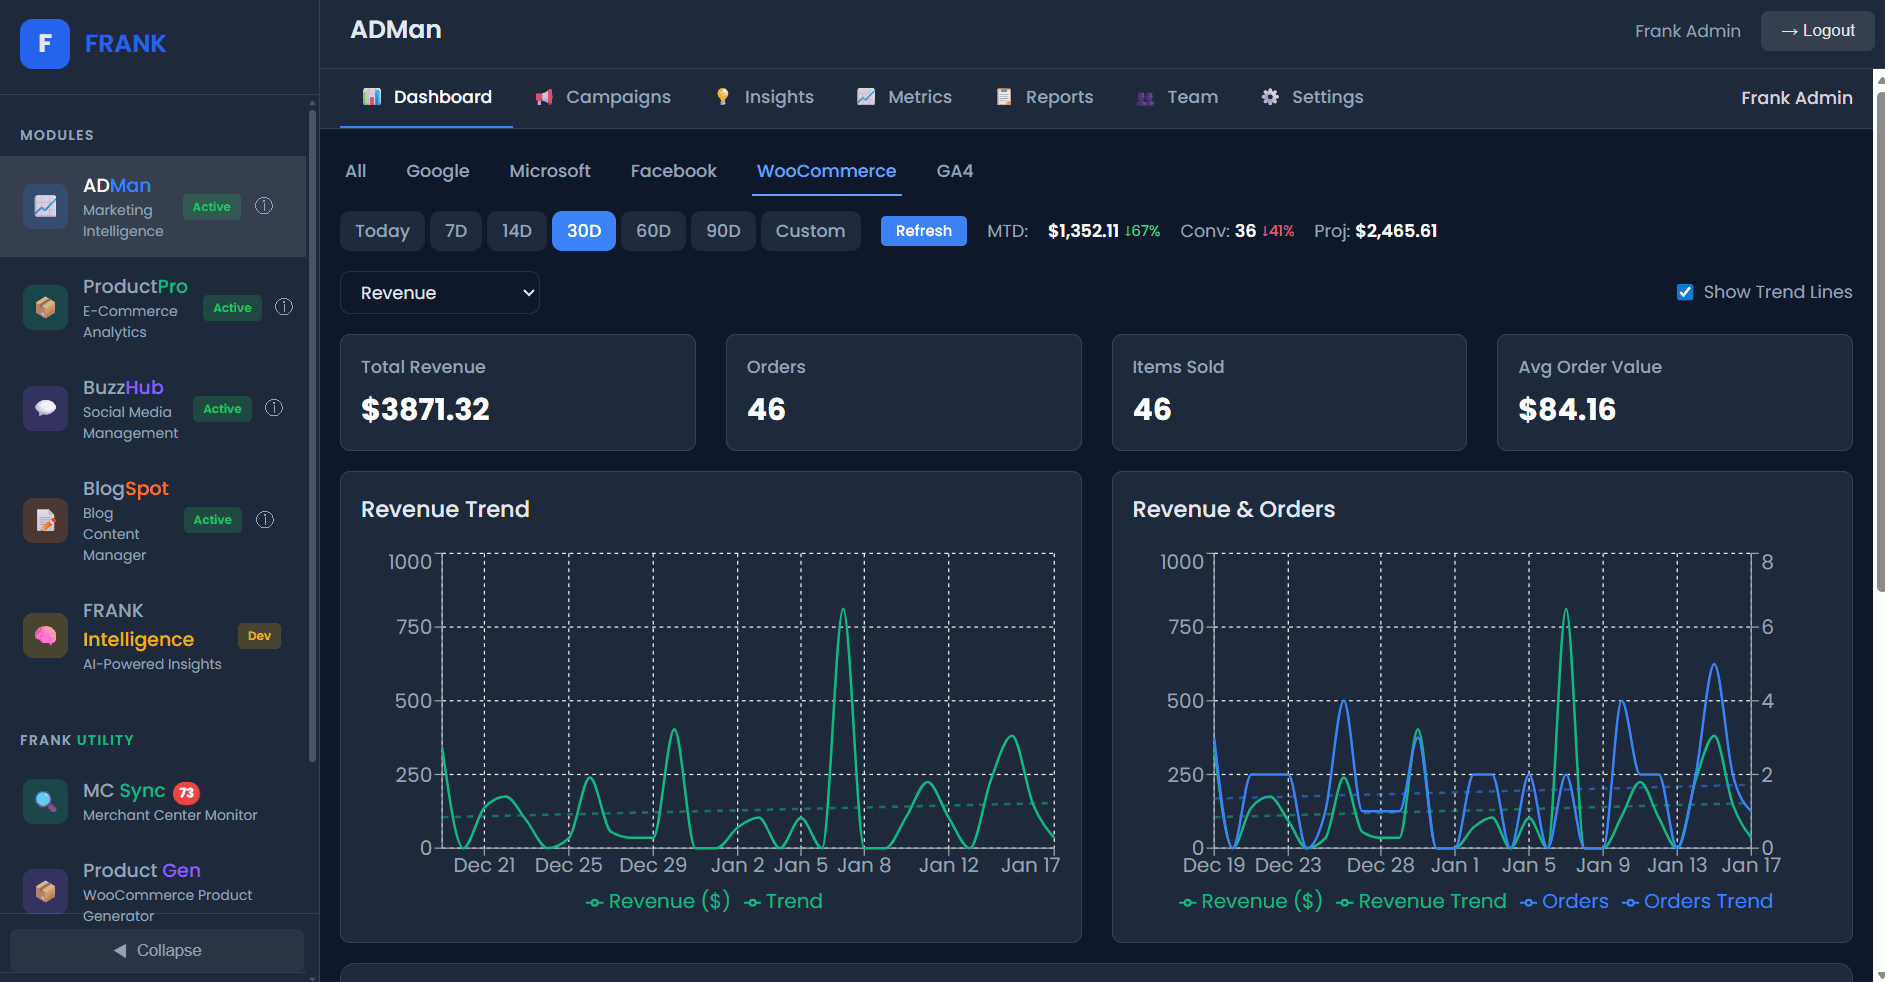
The First Module: ADMan
Let me tell you about the first piece of FRANK that actually
worked.
I called it ADMan, and it solved the most immediate pain
point I was experiencing: the advertising dashboard chaos. If you've ever run
ads on multiple platforms simultaneously—Google Ads, Facebook Ads, Microsoft
Ads—you know the nightmare. Each platform has its own dashboard, its own
metrics definitions, its own date range selectors, its own attribution models.
Want to know your total ad spend this month across all
platforms? Open three tabs, export three reports, massage the data into
comparable formats, and pray you didn't make an error somewhere. Want to
compare performance across platforms? Good luck—they're not even measuring the
same things the same way.
ADMan started simple: one dashboard that pulled data from
all my advertising platforms and displayed it in a unified view. Same date
ranges. Same metric definitions. Side-by-side comparisons that actually meant
something.
The first time I saw all my advertising data in one place, I
discovered something I'd missed for months: one platform was driving clicks
that almost never converted, while another platform was driving fewer clicks
that consistently turned into sales. I'd been optimizing for the wrong platform
because I was looking at each one in isolation.
That discovery paid for the time I spent building ADMan many
times over. And more importantly, it proved the concept: connected data reveals
what fragmented data hides.
What Comes Next
ADMan was just the beginning. FRANK has grown into a suite
of modules, each one designed to bring clarity to a different aspect of
business operations:
ProductPro connects your product catalog to your analytics.
Which products are actually driving your business? Not which ones have the
highest revenue—but which ones have the best margins, the lowest return rates,
the strongest customer satisfaction, the best advertising ROI? ProductPro
answers questions that WooCommerce reports alone can't touch.
BlogSpot turns content management into content intelligence.
Instead of publishing and hoping, you can see what's actually working, schedule
strategically, and use AI to help you create more of what resonates.
MCSync monitors the unsexy but critical connection between
your store and Google Merchant Center. Those sync issues you don't know about?
They're costing you money. MCSync catches them before they hurt.
BuzzHub (coming soon) will do for social media what ADMan
did for advertising: unified visibility across platforms, with actual
intelligence about what matters.
And eventually, tying it all together: FRANK Intelligence—an
AI layer that doesn't just show you your data, but interprets it. Tells you
what to focus on. Warns you about problems before they become crises. Answers
the question that started this whole journey: Is this business actually
healthy?
The Journey Continues
I'm writing this series for a specific reason: I believe the
tools we build should be explainable. The journey of building them should be
shareable. And the insights along the way might help someone else who's staring
at their own 2:47 AM problem.
FRANK isn't finished—honestly, I'm not sure it ever will be.
Every business teaches me something new about what clarity actually means.
Every integration reveals another micro-signal that deserves connection.
But here's what I know for certain: the chaos of fragmented
data isn't inevitable. The feeling of drowning in dashboards isn't your fault.
The inability to see your business clearly isn't a personal failing—it's a tool
failing.
And we can build better tools.
If you're an entrepreneur or small business owner who
resonates with any of this, I want to hear from you. What's your version of the
2:47 AM problem? What micro-signals are you missing connections between? What
would clarity look like for your business?
Because that's ultimately what FRANK is for: not for me, but
for all of us who believe that running a business shouldn't require a data
science degree. All of us who think that the insights should serve the business
owner, not the platform. All of us who want to stop drowning in data and start
swimming with clarity.
The journey continues. And I'm glad you're here for it.

──────────────────────────────────────────────────
Next in the series: "The Micro-Signal Problem: Why SMBs Can't See
the Forest"—a deeper dive into how data fragmentation affects small
business decision-making, and what we can do about it.
Follow the journey:
[frankdatainsights.com](https://frankdatainsights.com)
About the Author
Related Articles

Picking the Right Location Isn't a Gut Decision Anymore. Here's How Data Is Driving Ours.
Finding a new location comes with multiple financial and market inputs. We simplified the inputs to normalize our decision.

What If Your Business Intelligence Could 6x Your Revenue in One Quarter?
Increasing profit while reducing cost is the goal of every successful business.

HBCUs and the Post-Affirmative Action Era: Opportunity, Responsibility, and the Future of Higher Education
Historically Black Colleges and Universities have long played a critical role in shaping Black professional leadership in the United States. Following the Supreme Court’s decision to end race-conscious admissions, the higher education landscape is beginning to shift. Early data suggests changes in Black enrollment at some selective universities, while applications to HBCUs continue to grow. This moment presents both opportunity and responsibility. As the demand for HBCU education rises, institutions may need to rethink admissions standards, academic strategy, and their role in preparing students for an AI-driven economy where traditional career paths are rapidly evolving.