
Mine Did. Here’s How.
Back in 2024, when my wife launched her e-commerce store, we approached advertising the way most small businesses do. We spread budget across Google Ads, Microsoft Ads, and Facebook, trusting that the algorithms would figure things out over time.
They didn’t.
The platforms did exactly what they’re designed to do — spend money efficiently. The problem is, “efficiently” doesn’t always mean profitably. While impressions and clicks were coming in, revenue wasn’t keeping pace. We were feeding the machine, but the machine wasn’t feeding us back.
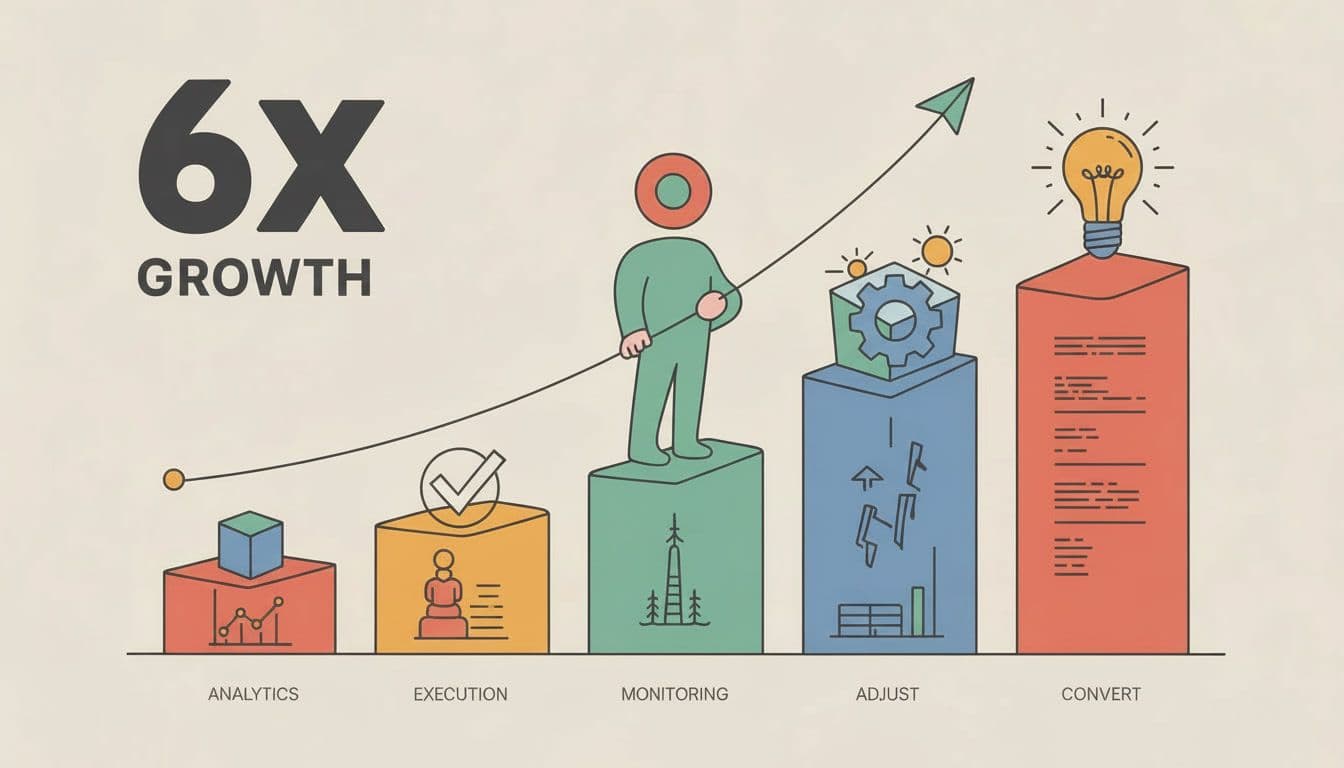
By Q1 2026, that changed. We reduced our ad spend by 31% and, at the same time, grew revenue sixfold.
The turning point wasn’t a new campaign. It was a shift in how we understood — and acted on — our data.
Seeing the Problem Clearly
At the start of Q1, we had hundreds of products in our WooCommerce catalog, all feeding into our shopping campaigns. On the surface, everything looked healthy — impressions were steady, traffic was flowing, and budgets were being fully utilized.
But when I connected the dots between ad performance and actual sales, a very different story started to emerge.
A significant portion of our ad spend was going toward products that had little value beyond the first sale due to the changing environment of tariffs along with items that were getting next to 0 conversions on one platform but killing it on another.
Some products had thousands of impressions with barely any clicks. Others generated clicks but never led to a purchase. In both cases, we were paying to drive traffic to pages that simply weren’t working.
Now, at first glance, this sounds like an easy problem to solve. Just look at the data, cut what’s not working, and move on.
But that assumption breaks down quickly in the real world.
When you’re managing 600+ products, across multiple platforms, with data living in dashboards and exported into spreadsheets, what sounds simple becomes complex fast. You’re not looking at a static snapshot — you’re dealing with something that changes constantly.
Performance shifts daily. Trends evolve weekly. Seasonality impacts monthly. And over time, each product tells a different story.
Trying to track that manually meant pulling reports, stitching together spreadsheets, comparing timeframes, and building a mental model of performance across hundreds of SKUs.
It wasn’t just time-consuming — it was unsustainable.
And more importantly, it made consistent, confident decision-making nearly impossible.
That’s when I realized we didn’t need more data.
We needed clarity — and the ability to act on it immediately.

Building a Foundation That Actually Works
To solve this, I built a system that evaluates each product based on three core signals: visibility, engagement, and conversion.
That became the foundation.
Every product, no matter how complex the dataset behind it, could be reduced to three simple questions:
1. Visibility - through impressions has the product had a chance to convert.
2. Engagement - if the product has click through how the customers are interacting.
3. Conversion - if the product has both Visibility and Engagement, at what rate is it converting.
Each question may lead to a number of alternatives, improve landing page, reduce price, etc.
Once those answers were clear, everything else could layer on top.
Because most tools jump straight into complexity — dashboards, filters, reports — without ever simplifying the core signal. Without a foundation, everything becomes noise.
But once the foundation is in place, you can build real logic:
And once that structure was in place, the patterns started to reveal themselves almost immediately.
Understanding the Difference Between a Bad Product and a Bad Listing
One of the biggest shifts came from realizing that not all underperformance is the same.
Before, the instinct was simple: if it’s not working, cut it.
But that approach leaves money on the table.
Some products truly had no demand — those needed to go.
But others were being seen and ignored, pointing to weak imagery or titles. Some were getting clicks but not converting, which meant the issue was on the product page — descriptions, pricing, or overall positioning.
So instead of making binary decisions, we built a structured approach:
And just as important:
This turned product management into an active system instead of a one-time decision.
From Insight to Action — Without Leaving the System
Here’s where things really changed.
Most tools will tell you what’s wrong.
Very few let you act on it immediately.
We built a system that wasn’t just to analyze — it was built to execute.
From the same interface, we could:
Read the data, make a decision, update landing page copy, images, reduce price, and remove from a platform if needed.
Because the reality is simple: insight without action doesn’t create value.
And if you have to leave the system to act, you slow down decision-making — or worse, you don’t act at all.
The goal became clear:
Don’t just answer the question — act on it in the same moment, in the same place. The reason 6x happened in 1 quarter and not 1 year.
Letting Data Drive Pricing and Inventory Decisions
As the system matured, it started influencing more than just ad spend — it shaped pricing and inventory strategy as well.
We identified products that were getting attention but not converting at their current price point. In those cases, a targeted adjustment unlocked performance.
We also flagged inventory that was aging and needed to move before it became dead stock.
Instead of guessing, decisions were driven by data.
And this is continuing to evolve.
Currently in development is the ability to incorporate Google’s competitor pricing signals directly into the decision-making process, alongside raw competitor data.
That means:
Connecting Marketing to Supply Chain Reality
Another layer came from connecting product performance to supply chain data.
In one case, we had a product sourced overseas with low remaining inventory and no cost-effective way to reorder.
Even if it sold, it wasn’t scalable.
So we didn’t push it.
That’s not something ad platforms will ever tell you. They don’t know your margins, your lead times, or your supplier constraints.
But once those factors were part of the system, decisions became more complete — and more profitable.
Seeing the Truth Across Platforms
At the same time, we needed a clearer view of performance across channels.
When we pulled everything into one view — Google, Microsoft, Facebook — the differences were obvious.
Some channels were delivering strong returns.
Others were quietly draining budget.
More importantly, performance wasn’t just platform-dependent — it was brand-dependent.
Some brands performed best on Google, where buyers had high intent.
Others performed better on social platforms, where discovery and visual appeal drove engagement.
That insight changed how we allocated spend.
Instead of spreading budget evenly, we aligned products and brands with the platforms where they naturally performed best.
The Compound Effect
None of these changes, on their own, would have produced a 6x increase in revenue.
But together, they created a compounding effect.
We removed wasted spend.
We improved products that had potential.
We adjusted pricing strategically.
We matched products to the right platforms.
The result:
Every dollar worked harder.
The reduction in ad spend came from eliminating inefficiency.
The revenue growth came from focusing on what actually worked.
What This Really Taught Me
Most of our advertising waste didn't come from bad products.
It came from promoting the right products in the wrong places.
Ad platforms are built to spend your budget.
Your job is to make sure they’re spending it on things that actually generate return.
And to do that, you need your product data, advertising data, and operational reality connected — not separated.
If you’re running ads across multiple platforms and managing a growing catalog, ask yourself:
Do you truly know which products deserve your ad dollars — and where they should be promoted?
Or are you still guessing?
Because the gap between those two is where the biggest opportunity lives.
We still have an issue with ROAS 1.27 in Q1. Target is 3X, stay tuned...
About the Author

Related Articles

Picking the Right Location Isn't a Gut Decision Anymore. Here's How Data Is Driving Ours.
Finding a new location comes with multiple financial and market inputs. We simplified the inputs to normalize our decision.

HBCUs and the Post-Affirmative Action Era: Opportunity, Responsibility, and the Future of Higher Education
Historically Black Colleges and Universities have long played a critical role in shaping Black professional leadership in the United States. Following the Supreme Court’s decision to end race-conscious admissions, the higher education landscape is beginning to shift. Early data suggests changes in Black enrollment at some selective universities, while applications to HBCUs continue to grow. This moment presents both opportunity and responsibility. As the demand for HBCU education rises, institutions may need to rethink admissions standards, academic strategy, and their role in preparing students for an AI-driven economy where traditional career paths are rapidly evolving.

What If? Beyond the 2028 Global Intelligence Crisis: From Job Displacement to Distributed Ownership
What if Ai creates a new era of reimagining work, DTC and Corporations as a foundation of work worldwide.